Introduction to PRML
Presenting Chapter 9 "Introduction to PRML" from Alex Taratorin's book "Characterization of Magnetic Recording Systems: A Practical Approach"
9. Introduction to PRML
- 9.1 PRML Detection System
- 9.2 PRML Bandwidth and Frequency Response
- 9.3 Partial Response Polynomials. EPR4 and E2PR4 Systems
- 9.4 Channel and User Densities of PR4, EPR4 and E2PR4
- References

When recording density is low, each transition written on the magnetic medium results in a relatively isolated peak of voltage and peak detection method is used to recover written information. However, when PW50 becomes comparable with the channel bit period, thepeak detection channel can not provide reliable data detection. In chapter 3 we have discussed the source of errors in peak detection. Superposition of pulses (linear ISI) shifts peaks of read-back signal and increased probability of errors in zero-crossing detector (refer to Fig.3.7). At the same time, signal amplitude is lowered and errors in the threshold detector part also increase. Whatever tricks are made with peak detection systems, they barely work at PW50/T ratios above 1.
This means that a different detection principle is needed if the density of recording is to be increased. This new detection method should not be based on voltage peaks, rather it should take into account the fact that signals from adjacent transitions interfere. In other words, the method of detection should be aware of linear ISI in the signal.
PRML is the most popular detection scheme in modern disk drives. PRML is an acronym for Partial Response Maximum Likelihood. This method was originally proposed in the early 70’s by a group of IBM researchers. PRML consists of two relatively independent parts: Partial Response (PR) and Maximum Likelihood (ML) detector. In the mean time we can temporarily think of Maximum Likelihood as a magic digital “black box” which improves the error rate of the system compared to usual threshold detectors.
PRML is based on two assumptions:
- The shape of read-back signal from an isolated transition is exactly known and determined.
- The superposition of signals from adjacent transitions is linear.
A block diagram of a typical PRML system is shown in Figure 9.1. It is relatively simple and we will now explain how it works.
Analog signal, coming from the magnetic head should have a certain and constant level of amplification. This is done in a variable gain amplifier (VGA). To keep a signal level, VGA gets a control signal from a Clock and Gain recovery system.
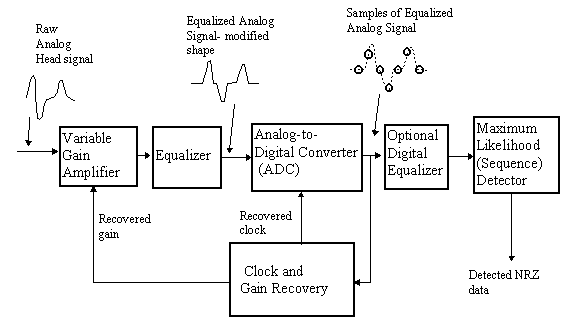
Figure 9.2 Block Diagram of typical PRML system
The shape of the read-back signal, coming from the head usually has to be modified. In the mean time we can think about this shape modification as adjustment of the pulse width to make it exactly proportional to the distance between transitions. Usually it means that the pulse, resulting from isolated transition, should have relatively flat tails. This shape modification is done by an equalizer. An equalizer is a linear programmable filter having specific frequency response. Analog signal on the equalizer output has a slightly different shape than the unmodified signal coming directly from the magnetic head.
The signal from the equalizer output is sampled by an Analog-to-Digital Converter (ADC). The sampling is initiated by clock signal exactly one time per channel bit period. Frequency and phase of the clock signal is adjusted by a clock recovery system. Signal on the ADC output is a stream of digital samples.
Digital samples are sometimes filtered by an additional digital filter. This second filtering operation can improve the quality of analog equalization.
The samples on the ADC output are used to actually detect the presence of transitions in the read-back signal. If signal quality is good, a simple threshold detector can be used to distinguish between zero signal and transition by comparing sample values to a threshold. However, much better detection quality can be provided by a Maximum Likelihood detector.
Note that no assumption that the signal should contain isolated and relatively narrow peaks was used. We now distinguish between zero signal and transition by looking at the ADC samples of the signal, and these samples are not necessarily taken at the signal peak level.
The most unclear signal transformation in Figure 9.1 is equalization. What does it mean that the pulse of voltage should have a pre-determined shape? To answer this question let us consider Class IV partial response, or PR4 system.
The isolated pulse shape in a PR4 system is shown in Figure 9.2.
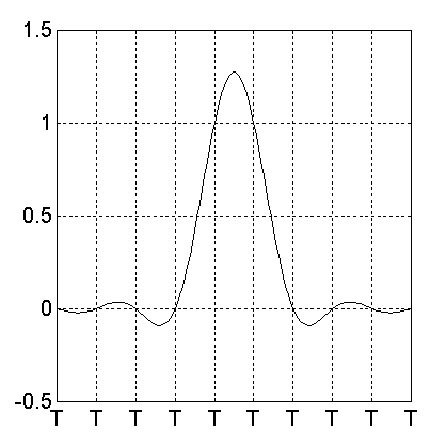
Figure 9.2 Shape of Isolated Pulse in PR4 system
The transition is written at time instant t=0, where T is the channel bit period. The shape is somewhat strange, it is oscillating and the pulse values at integer number of bit periods before the transition are exactly zeroes. However, at t=0 and at t=T, i.e. one bit period later, the values of the pulse are equal to “1”. The pulse of voltage reaches its peak amplitude of 1.273 at one half of the bit period.
Assume that an isolated transition is written on the medium and the pulse of voltage shown in Fig. 9.2 comes to the PRML system. The PR4 system requires that the samples of this pulse taken by ADC should correspond to the bit periods. Therefore, samples of the isolated PR4 pulse on the output of ADC will be: 00…011000….Of course value “1” is used for convenience and in reality it corresponds to some ADC level.
The fact that the isolated transition has two non-zero samples: one at the transition location and one at the next transition location is very important: we assume that if the next transition is written, the pulses will interfere.
What happens if we write another transition after the first one? Obviously, we will have superposition between both pulses, usually called a dipulse response as shown in Figure 9.3.
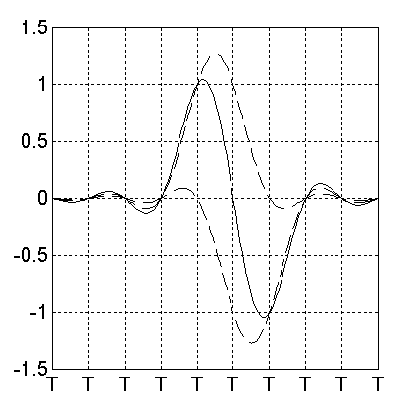
Figure 9.3 A dipulse response
Note that at sample points we have { …,0,0,1,0,-1,0,0,…..}.
    0 0 0 1 1 0 0 0 - from the first transition
+   0 0 0 0-1-1 0 0 - from the second transition
    ________________
=   0 0 0 1 0-1 0 0
What happens if we have three consecutive transitions (tribit)? It is easy to check that the answer is {…,0,0,1,0,0,1,0,0,…}. Another useful pattern is “low frequency” where transitions are separated by one clock. Obviously, the sequence of resulting samples is {…,+1,+1,-1,-1,+1,+1,-1,-1,+1,+1,….}.
Now it is clear, that having the sequence of samples from the ADC output, we can easily reconstruct any pattern which was written on the medium. The current value of the pattern P(k) in NRZ form (i.e. 1 and 0 means different medium magnetization), is reconstructed from the current sample s(k) simply as:
P(k)=s(k)+P(k-2) (9.1)
Let us consider how (9.1) applies to an isolated transition.
NRZ magnetization of medium is: 0 0 0 0 1 1 1 1 1 1 1…
Samples of PRML system: 0 0 0 0 1 1 0 0 0 0 0 …
Recovered NRZ data will be: 0 0 0 0 1 1 1 1 1 1 1 ….
Now let us consider a tribit – three consecutive transitions.
NRZ magnetization of medium is: 0 0 0 0 1 0 1 1 1 1 1…
Samples of PRML system: 0 0 0 0 1 0 0 1 0 0 0 …
Recovered NRZ data will be: 0 0 0 0 1 0 1 1 1 1 1 ….
This last example is especially interesting: the second pulse in the tribit has zero samples, it is almost completely suppressed by the first and the third transitions due to linear superposition! However we can easily recover the data based on the samples.
This is the main principle of PRML: we are no longer afraid of linear ISI. Once the pulses can be reduced to some “standard” shape, the data pattern is easily recovered because superposition of signals from adjacent transitions is known. In our example, we know that sample “1” is suppressed by “-1” if the next transition is written etc.
It is easy to check that all possible linear superpositions of the samples result in only three possible values: {-1, 0, +1}. A positive pulse of voltage is always followed by a negative pulse and vice versa. Therefore, a sample with a value of 2 can not be generated by any linear superposition and ADC output will consist of only three distinct levels: {-1, 0. +1}.
For a PR4 system we may look at the output of ADC on Figure 9.1 and analyze a sequence of samples. If all parts of the PRML system are working properly (i.e. the equalization, gain and timing recovery are correct and the signal is noise-free), the ADC samples should take only nominal values (such as {-1,0,+1} for PR4 system). Noise, NLTS, wrong equalization, jitter etc. distort these sample values.
A simple way to characterize the sample quality is to build their histogram (also known as sample values distribution). A histogram is a function which corresponds to the number of samples having a particular value. If a sufficiently large number of samples is taken, we will be able to see the histograms shown in Figure 9.4. The left picture is obtained for a PR4 system with good quality. Three distinct peaks corresponding to levels {-1,0,+1} are clearly seen. The right picture has poor quality: distributions of samples overlap, i.e. in some cases zero samples look like +1 or -1 samples and vice versa.
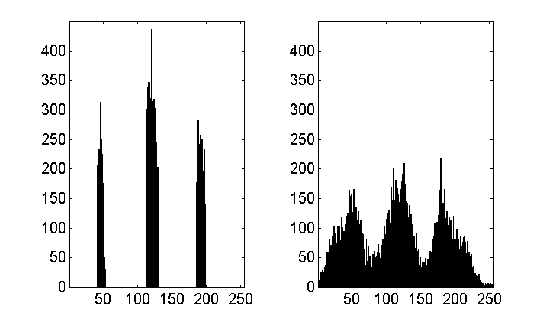
Figure 9.4. Sample Value Distributions for good (left) and poor (right) PRML signal quality.
Engineers are also used to look at “Eye Diagrams” or “Eye Patterns”. To obtain an eye pattern we need a random data pattern written on the disk and a scope (a digital scope with screen memory is preferable). Synchronization should be taken from the clock signal and the signal from the equalizer output. What we expect to see is superposition of random equalized waveforms from different parts of our pattern. Since all these waveforms are synchronized to the PRML clock we observe an interesting “focusing” pattern: all waveforms at clock points pass through the three points corresponding to {-1,0,+1} (as shown in Figure 9.5).
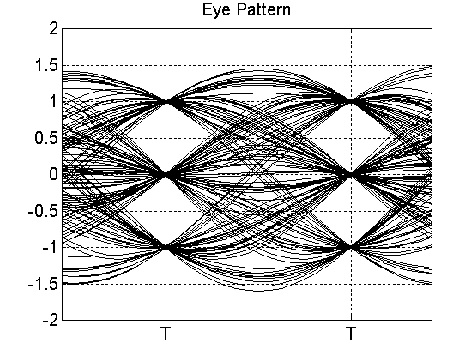
Figure 9.5. Example of an Eye Pattern for PR4 system
If sample distributions do not overlap, or, equivalently, the “eyes” on the eye diagram are open, signal detection can be done using a simple comparator (threshold detector). Maximum Likelihood circuitry may not be needed to achieve reasonably low error rates.
If histograms of samples overlap similar to those shown in Figure 9.4, the ML detector will greatly improve the situation. The typical gain of an ML detector over a simple comparator is about three or more orders of magnitude in error rate. While it is possible that the Maximum Likelihood detector will still be able to decode the pattern in a case of strongly overlapping samples, the probability of errors is increased and, obviously, non-overlapping histograms are always better.
How can a maximum likelihood detector possibly improve detection? To explain why ML detection is good, we must first explain why threshold detection is bad.
As we remember, samples on the output of ADC ideally have a small number of levels, such as {-1,0,+1} for the PR4 system. Evidently, a threshold detector could be set to classify a current sample value comparing it to an amplitude threshold, e.g. if sample > 0.5 then sample = 1, if sample < -0.5 then sample = -1, if |sample| <= 0.5 then sample = 0. Imagine that we are looking at a stream of noisy samples :
0.8 0.3 -0.7 -0.2 0.6 0.9 1.1 0.2
For this sequence of samples, the threshold detector output would be:
1 0 -1 0 1 1 1 0
If we look at these values, we notice a strange sequence of three “ones” in the row. This sequence of three “ones” can not exist! Indeed, “11” always means an isolated transition. The next transition should be of opposite polarity, therefore the only possible combinations are “011”, “110”, “-111”, etc.
The Threshold detector knows nothing about the previous and subsequent samples and compares each sample with the threshold. An ML detector is smarter. It “knows” that “111” is a forbidden sequence of samples and tries to decide which was the most probable data pattern which caused this sequence of samples.
It is easy to propose several close allowable sequences: {1 0 -1 0 1 1 0 0} or {1 0 -1 0 0 1 1 0} or {1 0 -1 0 0 0 1 1}. Which one is the most probable? Let us look at these sequences again:
0.8 0.3 -0.7 -0.2 0.6 0.9 1.1 0.2 Samples
------------------------------------------
1 0 -1 0 1 1 0 0 Sequence #1
1 0 -1 0 0 1 1 0 Sequence #2
1 0 -1 0 0 0 1 1 Sequence #3
Sequence #1 assumes that 0.6 and 0.9 values are “1” and 1.1 value is “0” which does not look very probable. Sequence #2 assumes that 0.6 is in fact “0” while 0.9 and 1.1 are “1”. Sequence #3 assumes that 0.6 and 0.9 are “0” and 1.1 and 0.2 are “1”. Obviously, Sequence #2 is the most reasonable assumption. We can verify it by calculating Mean-Squared Distance (MSD) between sampless(k) and assumed sequence b(k):
![]()
Sequence #1: MSD = 1.2961
Sequence #2: MSD = 0.8246
Sequence #3: MSD = 1.4422
As seen, Sequence #2 is the closest to the original samples sequence and at the same time satisfies our constraints. In other words, this sequence is the most likely among other candidate sequences.
This simple example demonstrates the principles of ML detection:
Decisions are made based on a sequence of samples, instead of one current sample.
For each sequence of samples a list of allowable sequences is generated.
Each of the allowable sequences is compared with the received sequence and MSD (or any other distance function) is calculated.
The sequence having the minimum distance (maximum likelihood) is selected to be the result of the detection.
- Decisions of the ML detector are always done with some delay.
Of course, practical realization of the described ML detector is difficult. We do not know how to choose the sequence length. If we start from the first sample and analyze all possible sequences, after each additional sample, the number of possible combinations which should be analyzed grows exponentially. Another problem is that detection should be done in real time together with the rate of incoming samples and delays should be small enough to avoid overflow. The solution to these problems was found by A.Viterbi in 1967. Fascinating features of the Viterbi algorithm are that it is equivalent to full-blown Maximum Likelihood detection and that it can be realized in real time using moderately complex hardware.
What should be stressed here is that the Viterbi algorithm is only (although smart and ingenious) a practical realization of the Maximum Likelihood detection principle which opened the way for effective real-time data detection. For a while we can think about the ML detector as a “black box” accepting ADC samples and providing decoded data on its output.
While the outlying principles of PRML are relatively simple, a lot of confusion is caused when the bandwidth of the PRML channel is discussed.
Let us consider the spectrum of the head read-back signal. A good approximation of this spectrum is obtained when a random pattern is written on the disk.
On average, an equal number of positive and negative transitions are written on the magnetic medium, therefore the spectrum content at zero frequency (DC-content) is zero. When recording density is low and pulses of voltage are narrow relative to the distance between transitions, the read-back signal will contain a high frequency component. Indeed, as is well known, the highest frequency in the signal spectrum corresponds to the fastest changing slope of the signal. A narrow pulse will have a wider spectrum than the wide, slowly changing pulse.
If we fix the channel bit period and write a random pattern with an increasing width of the pulses, the spectral energy distribution will shift to a lower and lower frequency range. Figure 9.6 demonstrates spectral energy distribution for several different ratios of PW50/T. For ratio of PW50/T=0.5, most of the spectral energy is concentrated at about one half of the clock rate frequency and significant spectral components extend up to the clock frequency itself. This means that for a system with low ISI, channel bandwidth should be consistent with the channel rate. However, for PW50/T=2, the signal spectrum is effectively concentrated below half of the channel clock rate given by 1/T. Some “tail” of this spectrum is still outside this “half-bandwidth” range, but the power of these high frequency components is relatively small.
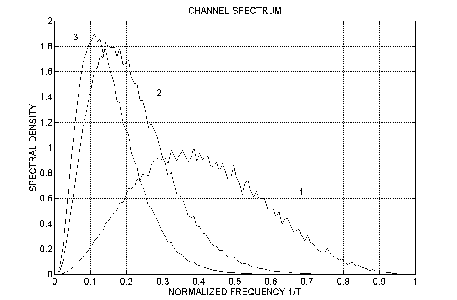
Figure 9.6 Magnetic recording channel spectrum. 1- PW50/T=0.5; 2 – PW50/T=2; 3 – PW50/T=3.
These spectral considerations are very important. In fact, if the ratio of PW50/T approaches 2 we can effectively limit the channel bandwidth to 1/2T without losing any information. This spectral limitation immediately gives SNR gain of 3 dB. Indeed, if the noise power is uniform within the bandwidth, the total noise power in one-half bandwidth will be exactly two times smaller than in the full bandwidth.
Using a signal spectrum, shown in Figure 9.6, we can now theoretically explain why the PRML system works. To do that we have to remind the reader of the sampling theorem (or the Nyquist sampling criteria).
Sampling theorem states that any analog band-limited signal having frequencies only below a highest frequency f max can be uniquely recovered from its discrete samples taken with sampling interval T1/2 f max . In other words, if a band-limited signal is sampled with a sampling period of at least 1/2 f max or smaller, the information content of the signal is not lost.
A simple interpretation of the sampling theorem can be given by looking at the sine wave signal with the highest frequency f max, present in the signal (Figure 9.7).
The period of the sine wave equals T=1/ f max . To be able to reconstruct this sine wave from samples we have to sample it so as catch at least all peaks (or zero-crossings) with a sampling rate of 1/2f max . In that case we will be able to recognize sine wave oscillations. Otherwise, for example, if the sampling rate equals the sine wave period, we will catch only positive peaks and may think this signal has a constant DC level.
Therefore, if we return to the head spectrum signal in Figure 9.6 for a ratio of PW50/T=2, we may conclude that if the analog read-back is sampled once per bit period (sampling rate =1/T), we will not lose information. Note, that this is not true when PW50/T is less than 1 because much of the spectral energy extends up to the channel clock frequency.
Now we also can explain the origin of the isolated pulse shape shown in Fig. 9.2. Since the PRML system has a bandwidth of 1/2T, the only band-limited function which is represented by samples “…0110…” is the response of the ideal low-pass filter on this sample sequence. Each “1” sample on the channel output will result in sin(x)/x type function and, therefore, the ideal isolated pulse for PR4 system is given by:
 (9.2)
(9.2)
Note that if the bandwidth of the channel is larger than 1/2T we can find different shapes of isolated pulses satisfying our criteria (as an extreme example of almost infinite bandwidth this shape could even be a rectangular pulse given by the same samples {…0,0,1,1,0,0,….}).
Let us now calculate the frequency response of the PR4 channel. As is well known, the frequency response is the Fourier transform of the channel impulse reaction. Our isolated pulse is called “step response” of the PR4 channel, or reaction to a “step” of magnetization. Using NRZ notation for channel input, this step is described by a sequence
000001111111… A derivative of the step reaction will be given by …00010000. In other words, it represents localized change of magnetization or a dipulse. Therefore, we have to calculate Fourier transform of the dipulse, having samples of {…10-1….}. From here:
![]() (9.3)
(9.3)
The frequency response of the PR4 channel is shown in Figure 9.8. As seen it has a peak at 1/4T, therefore it concentrates signal energy in the mid-band.
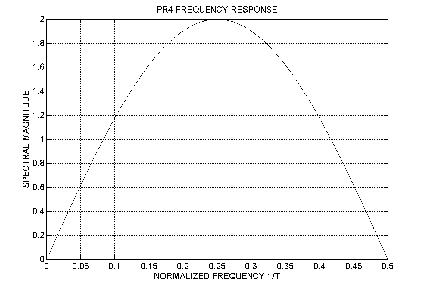
Figure 9.8 Frequency Response of PR4 channel
Different partial response schemes are often described using polynomials. These polynomials historically came from discrete signal processing terminology.
Let us describe an input data pattern in NRZ terms, i.e. “0” stands for one particular direction of medium magnetization and “1” for another. The data pattern is given by the sequence of bits ak .When a magnetic head reads the signal, it responds only to changes of magnetization, i.e. it differentiates the signal.
The differentiating function of the head can be described if we introduce a “delay operator” D, given by![]() . Obviously, the head acts on the NRZ pattern as
. Obviously, the head acts on the NRZ pattern as![]() . The operator given by (1-D) will result in +1 or -1 samples, depending on the direction of the magnetization change. Operator (1-D) is the simplest polynomial, corresponding to generating positive or negative samples.
. The operator given by (1-D) will result in +1 or -1 samples, depending on the direction of the magnetization change. Operator (1-D) is the simplest polynomial, corresponding to generating positive or negative samples.
In a PR4 system each pulse of voltage has 2 samples. In other words, if a transition of magnetization occurs, it results in a sample equal to “1” at the transition location and another sample at the next sample period. This is equivalent to “spreading” or delaying and adding the current sample, given by operator (1+D). Indeed, if ak =1, the operator (1+D) ak will result in sequence “1,1”. Therefore, a PR4 system in polynomial terms is described as (1-D)(1+D) = 1- D2, where operator D2 is the result of a product DD and delays the current sample two bit periods:![]() .
.
If we discard the differentiating part of the polynomial given by (1-D) and look only at (1+D) we will get the samples of the isolated pulse: {1,1}. In other words, the term (1+D) determines how the transition samples are “spread” over the neighboring bit periods. Partial Response 4 is a particular case of more general family of PR polynomials, given by the general equation:
![]() (9.4)
(9.4)
PR4 corresponds to n=1. If we set n=2 the samples of the isolated pulse will be given by the term![]() which corresponds to (1,2,1). This type of PRML is called “Extended Partial Response 4” or EPR4. When n=3, the polynomial is given by
which corresponds to (1,2,1). This type of PRML is called “Extended Partial Response 4” or EPR4. When n=3, the polynomial is given by![]() and the isolated pulse has samples {1,3,3,1}. This type of partial response is called E2PR4.
and the isolated pulse has samples {1,3,3,1}. This type of partial response is called E2PR4.
The following table summarizes different PRML schemes used in magnetic recording
| Name | Polynomial | Isolated Pulse Samples |
| PR4 | (1-D)(1+D) | 0 1 1 0… |
| EPR4 | (1-D)(1+D)2 | 0 1 2 1 0… |
| E2PR4 | (1-D)(1+D)3 | 0 1 3 3 1 0 … |
As we see from this table, isolated pulses become wider: EPR4 pulse extends over 3 bit periods and E2PR4 pulse over 4 bit periods. This means that the transition in an E2PR4 system will be “felt” by the next 3 transitions in the pattern.
Of course, the value of samples “2” or “3” are imaginary. Further in this text we will always normalize the isolated pulse amplitude to “1”. Using this notation, an EPR4 pulse has sample values {…,0,1/2,1,1/2,0,…} and is shown in Fig. 9.9.
Again, this analog pulse shape is obtained assuming that the channel bandwidth is limited by 1/2T. In this case each sample generates sinc(x)= sin(x)/x function where x=t/T and the isolated pulse shape is obtained by delaying and adding the corresponding sinc functions with the weights (1/2,1,1/2). The superposition of pulses for EPR4 results in 5 PRML sampling levels: {-1,-1/2,0,1/2,1}.
The EPR4 system is used both with (8/9) encoding and with (1,7) code. A dipulse response for EPR4 system is given by:
d=0 constraint:
  0  ½  1  ½  0
+    0 -½ -1 -½ 0
  _______________
= 0  ½  ½ -½ -½ 0
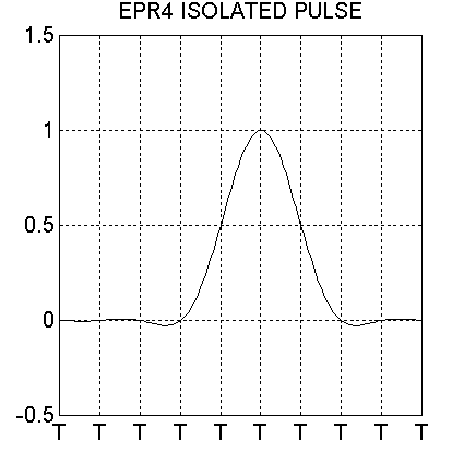
Figure 9.9 Isolated pulse for EPR4 system
with d=1 constraint EPR4 dipulse :
  0  ½  1  ½  0
+    0  0 -½ -1 -½  0
  ____________________
= 0  ½  1  0 -1 -½  0
E2PR4 isolated pulse samples are: {…,0,1/3,1,1,1/3,0,….}. The shape of this pulse is shown in Figure 9.10.
There are 7 possible sample levels in an E2PR4 system: {-1,-2/3,-1/3,0,1/3,2/3,1}.
An E2PR4 system is usually used with (1,7) encoding. A dipulse for an E2PR4 system and (1,7) code is given by:
  0 1/3   1     1  1/3    0    0
+     0   0  -1/3   -1   -1 -1/3  0
  __________________________________
= 0 1/3   1   2/3 -2/3   -1 -1/3  0
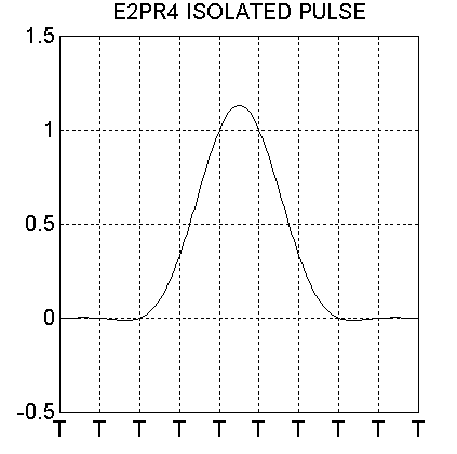
Figure 9.10. Isolated pulse shape for E2PR4 system.
Eye diagrams and sample value distributions for EPR4 and E2PR4 systems become complicated. For example, figure 9.11 present an eye diagram for an EPR4 system. As we see, there are 5 distinct “focusing” points and an EPR4 histogram will consist of 5 separate
peaks.
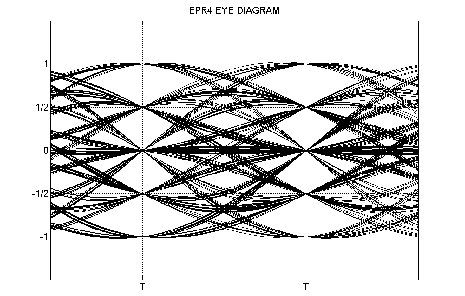
Figure 9.11 EPR4 system Eye Diagram
Similarly, an E2PR4 system will have 7 levels of the signal.
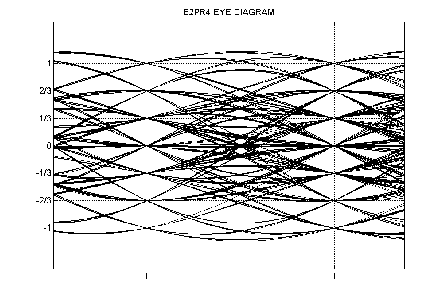
Figure 9.12 Eye diagram for E2PR4 system
Frequency responses of EPR4 and E2PR4 systems are calculated similar to PR4 as the spectrum of the dipulse response. They are shown in Figure 9.13.
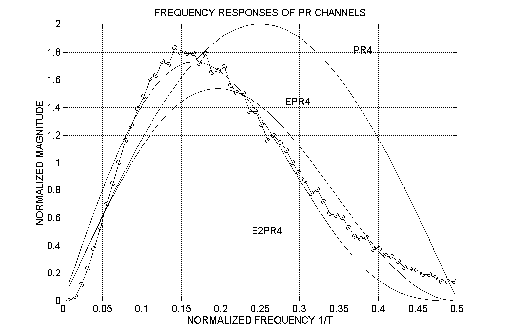
Figure 9.13 Frequency responses of PR4, EPR4 and E2PR4 systems versus channel frequency response for PW50/T =2 (circles)
Note from Figure 9.13 that E2PR4 provides the closest fit to the channel frequency response for PW50/T =2.
What are the advantages of using higher order PRML systems?
One advantage is obvious: we have more samples per clock period, therefore we can increase the recording density. In other words, if the pulse width is kept the same, the relative channel bit period can be increased.
Another, less obvious advantage, is that the shapes of the pulses shown in Figs. 9.9 and 9.10 are more “natural” and smooth compared to the PR4 isolated pulse. EPR4 and E2PR4 pulses have less oscillations and their bottom part is more extended. The peak of spectral density lies at 1/4T frequency for PR4 pulse (the center of the bandwidth range) and shifts to lower frequencies for EPR4 and E2PR4 pulses( Figure 9.13) . These lower frequency spectrum distributions are closer to a typical frequency content of raw non-equalized pulses. Therefore, equalization for extended PRML can become less critical and requires a less high frequency boost which may improve signal to noise ratio.
Finally, the last advantage of high order PRML schemes is that since we have some extra density gains compared to the PR4 (remember, our pulse now extends over 3 – 4 samples), we can well afford to lose it and to return to the (1,7) code (i.e. write zero between each pair of transitions). While this hardly seems to be a rational solution, it can in fact have advantages when strong non-linear distortions are present. Nonlinear distortions strongly depend on the degree of pulse overlapping. If EPR or E2PR4 pulses are separated by two clock intervals, their overlapping parts are on the “tails” of the pulses, while superposition of PR4 pulses cover about 2/3 of the pulse width. Therefore, resulting non-linearities for EPR4 and E2PR4 are weaker. At the same time, an E2PR4 scheme with (1,7) code can achieve the same density as PR4 with (0,4/4).
The main disadvantage of extended PRML schemes is the increased complexity of circuits and decoders. While the PR4 system works with 3 levels of samples, the E2PR4 system works with 7 levels. It requires a higher resolution of ADC, a complicated timing and gain recovery circuit and a sophisticated ML detector. In fact, the complexity of ML detectors grows exponentially with the number of levels. Realization of the fast Viterbi detector for an extended PRML is extremely complicated and sub optimal Sequence Detectors are typically used. Another problem with a higher order PRML schemes is that they have higher sensitivity to noise compared to PR4.
As we have discussed in Chapter 2, Channel Density is the ratio of the pulse width PW50 to the channel bit period. How do we determine channel density for PRML schemes?
The problem with definition of the channel density lies in equalization, i.e. the original, non-equalized pulses read by the magnetic head are different from the pulses on the equalizer output. However, in an ideal case, pulse width is adjusted to the channel density, (i.e. the width of an isolated pulse before equalization should be close to the width of an equalized pulse). This means that the bandwidths of unequalized and equalized signals are the same. In this case the equalizer does not introduce excessive noise boost and the channel density is optimal for PRML. We consider that pulses are equalized to their ideal shapes and calculate the channel density given by PW50/T, assuming that PW50 is calculated for 50% of the unipolar pulse amplitude. Results of the calculation are:
Dch(PR4) = 1.65
Dch(EPR4) = 2
Dch(E2PR4) = 2.31
Therefore, if, for example, the PW50 parameter of the pulse coming from the magnetic head equals 16.5 ns, the optimal channel clock for a PR4 system will be close to 10 ns.
User Density is defined taking encoding into account.
![]()
where R is the code rate. The definition of User Density is how many bits of Input pattern (User) information can be stored in a unit of the medium.
Let us compare a PRML system with peak detection. A marginal channel density for peak detection is achieved when the resolution is 70% and PW50=T with d=0. However, all peak detection systems use (1,7) encoding and the channel bit period is two times smaller, therefore peak detection channel density is 2. User density for a peak detection system is 2*2/3=4/3 = 1.33.
For a PR4 system with (0,4/4) encoding we lose 8/9 on encoding but have a channel density 1.65 and our resulting user density is 1.46.
An E2PR4 system has a natural channel density of 2.31 and with (1,7) encoding this gives us a user density of 1.54. Note that this is almost the same as for a PR4 system with 8/9 code. However, since d=1 constraint is used for E2PR4, the actual distance between transitions on the medium is increased and non-linear distortions are reduced.
The following table provides a comparison of user densities for different detection methods:
| Method | User Density(1,7) rate 2/3 Code | User Density(0,4/4) rate 8/9 code |
| Peak Detection (70% resolution) | 1.33 | 0.88 |
| Peak Detection(80% resolution) | 1 | 0.66 |
| PR4 | 1.1 | 1.46 |
| EPR4 | 1.33 | 1.77 |
| E2PR4 | 1.54 | 2.05 |
This comparison of density gains is almost meaningless. Real comparison should take into consideration the different sensitivity of Peak detection and different PRML schemes to noise, non-linear distortions, equalization etc. Typically about 30% gains could be achieved using PRML and PRML provides about a 20% increase in the off-track performance.
- John C.Mallinson “The Foundations of Magnetic Recording” – Academic Press, 1993. A good introduction into principles of magnetic recording, contains short description of PRML principles.
- B. Sklar “Digital Communications. Fundamentals and Applications” – Prentice Hall, 1988. A useful textbook, contains description of partial response, convolutional codes and Viterbi decoding algorithm.
- P.H.Siegel and J.K.Wolf “Modulation and Coding for Information Storage” – IEEE Communications magazine, December 1991, pp. 68-86. An informative review paper describing the principles of Peak Detection, PRML and coding.
- R.D.Cidecyan, F.Dolvio, R. Hermann, W.Hirt, W. Schott “A PRML System for Digital Magnetic Recording” – IEEE Journal on Selected Areas in Communications, – 1992, vol.10, No.1, pp.38 -56. The only available relatively detailed review of the PRML system, including principles, Viterbi algorithm, Encoding, Gain and Clock Recovery.
- Howell, D.P. McCown et al. “Error Rate Performance of Experimental Gigabit per Square Inch Recording Components” – IEEE Transactions on Magnetics, 1990, vol . 26, 5, pp. 2298-2302. A short description of the IBM prototype PRML channel, includes useful discussion of equalization and non-linear distortions.
- J.D. Cocker, R.L. Galbraith, G.J. Kerwin, J.W. Rae and P.Ziperovich “Implementation of PRML in a Rigid Disk Drive” – IEEE Trans. Magnetics, vol. 2,6, 1991, pp. 4538-4543.
- A short description of first IBM PRML drive J.Hong, R. Wood and D. Chan “An experimental 180 Mb/sec PRML Channel for Magnetic Recording” – IEEE Trans. Magnetics, vol. 27, 6 pp.4532-4537, 1991.
- A very useful paper for understanding PRML, equalization and timing recovery H.Thapar and A.Patel “A Class of Partial Response Systems for Increasing Storage Density in Magnetic Recording” – IEEE Trans. Magnetics, vol. 23, 5, pp.3666-3668 1987 – Discussion and comparison of high order PRML systems.
Copyright © 1996
Last Modified: January 27, 2005

